Output
Here is an example GOnet output graph
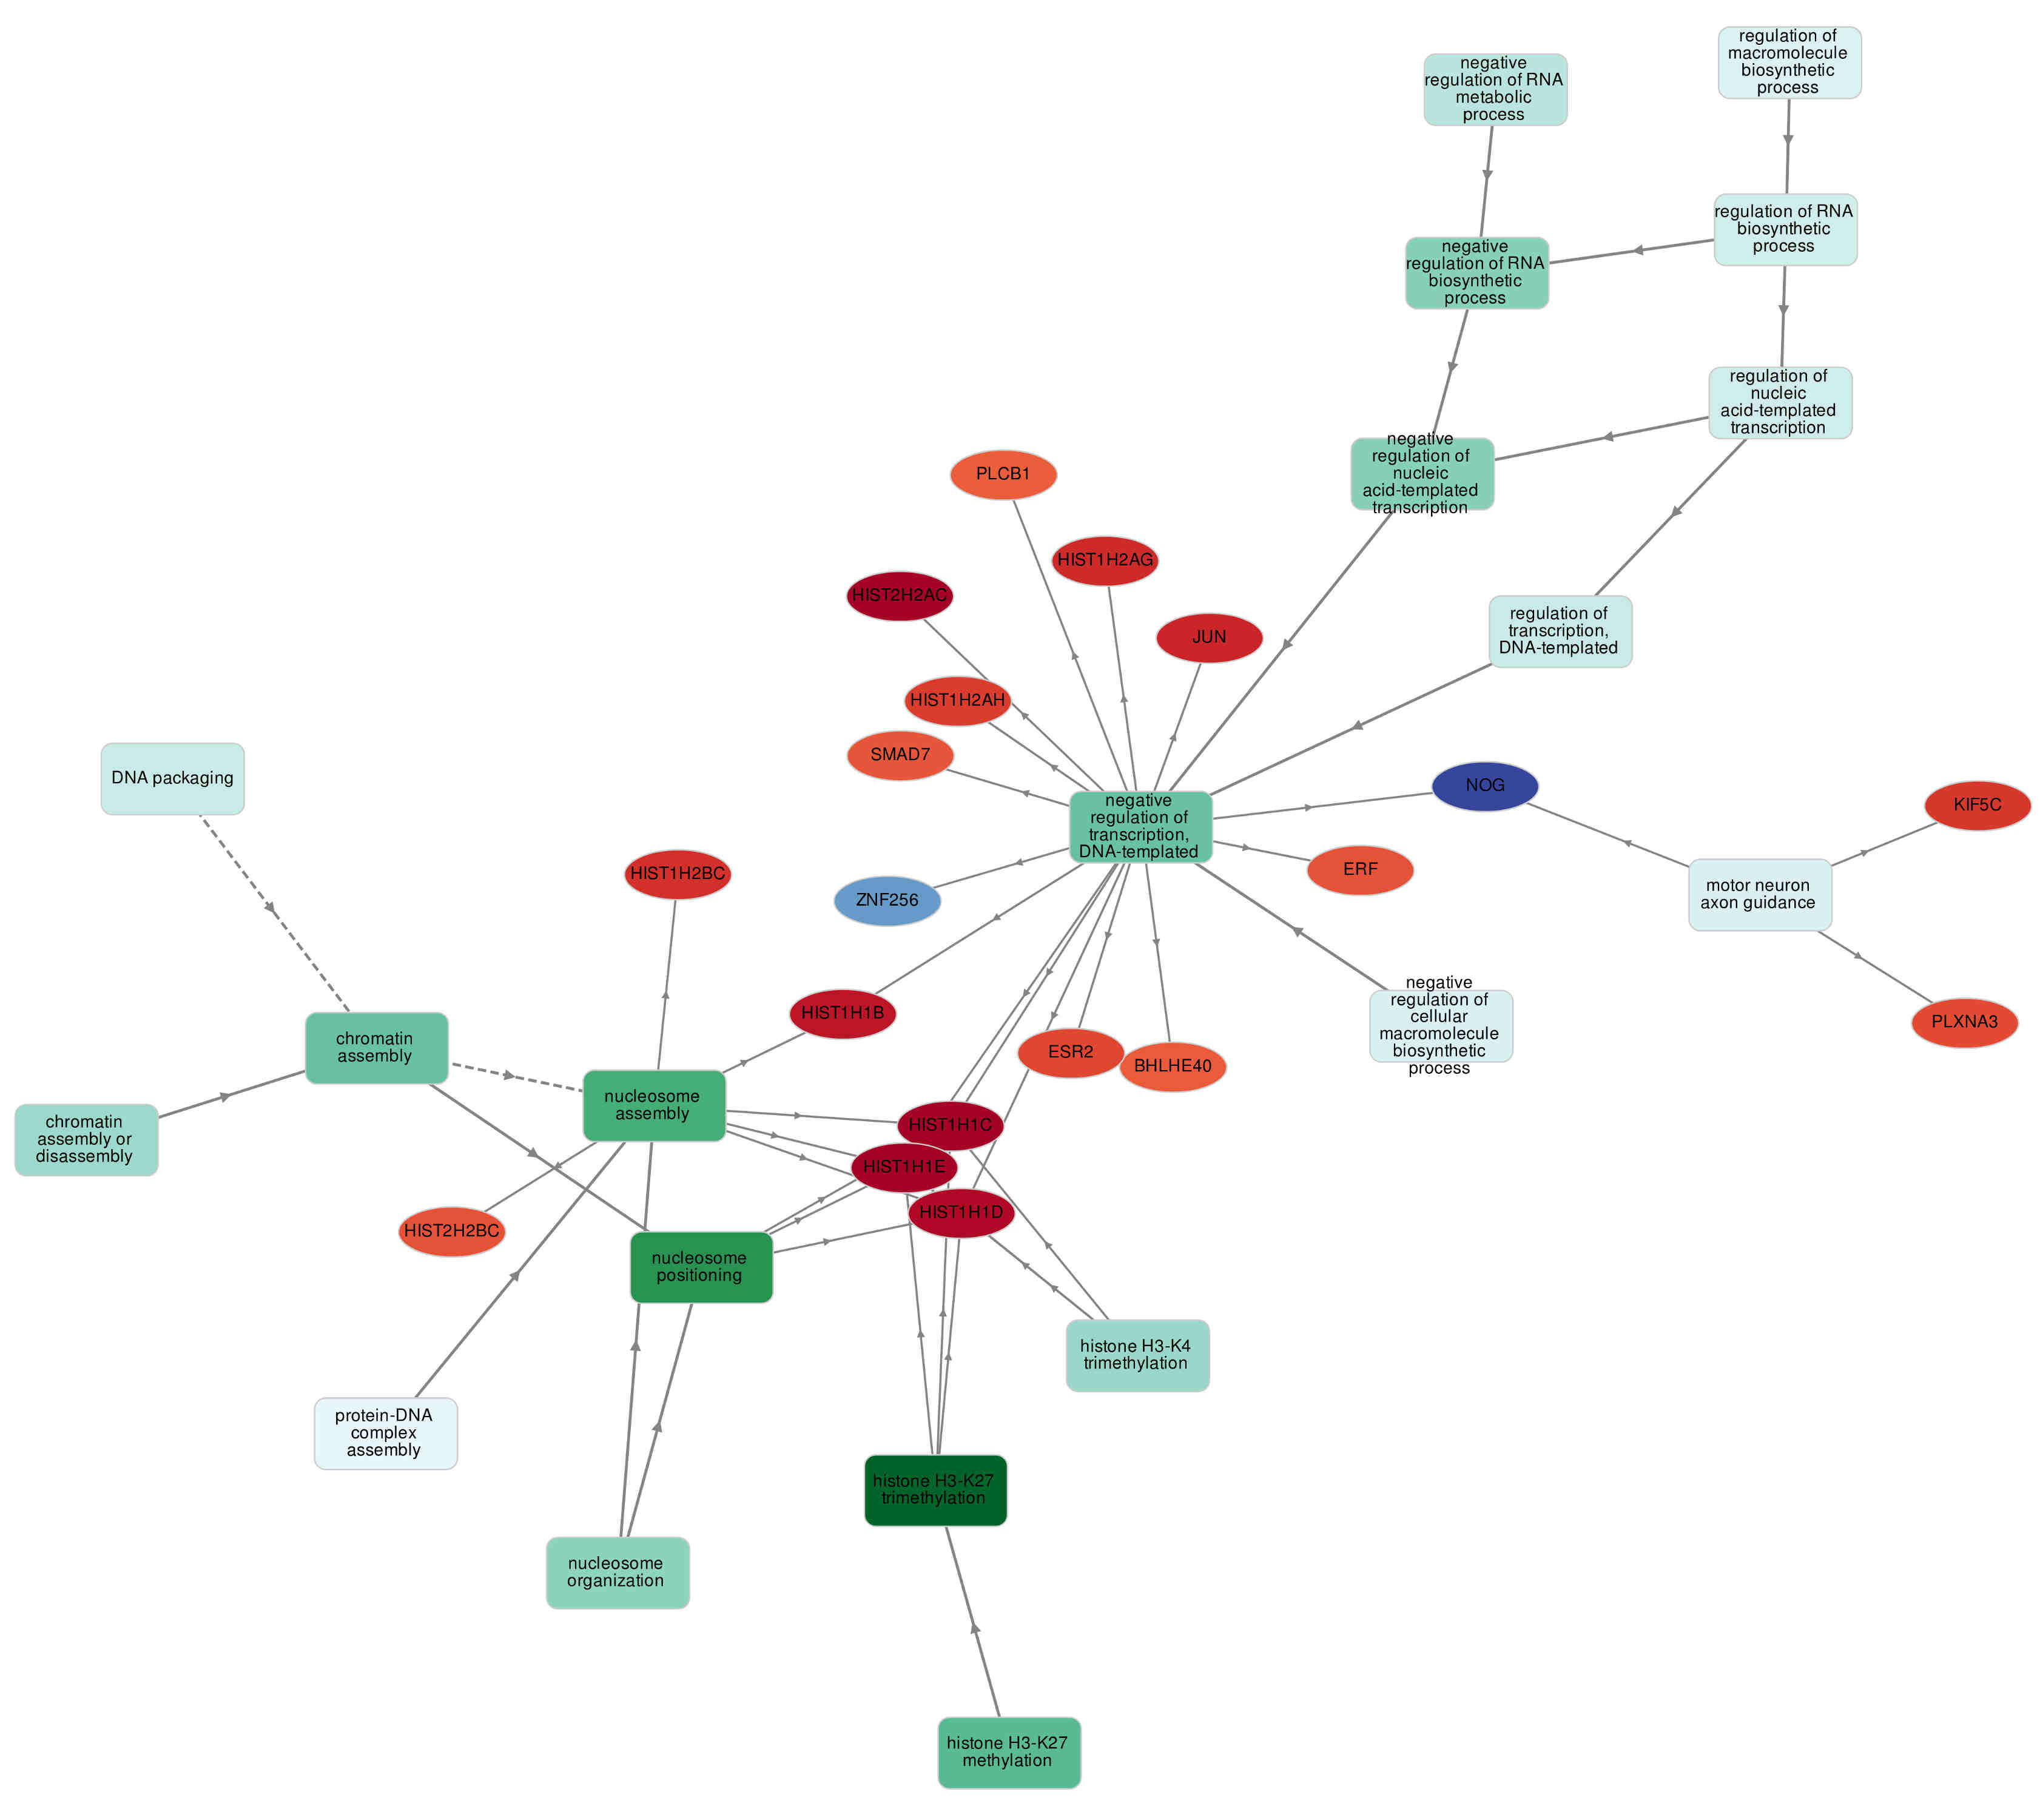
There are two apparently distinguishable types of nodes: GO terms and genes. Accordingly, there are two types of edges: connecting two GO terms and connecting a GO term and a gene. When edge connects two GO terms the arrow is directed from the less specific term to the more specific term. When edge connects GO term and a gene it is always directed towards the gene. GO term nodes are colored by p-value of enrichment (in case of GO enrichment analysis): the more significant enrichment of the term (the smaller p-value) the more intense the color of the node. Genes are colored (in this particular example) by expression in CD4 naive T cells. It is important to note that genes are always connected to the most specific term possible though ontologies can be always propagated to less specific terms. For example, HIST1H1E is connected to "Nucleosome assembly" though of course it is involved in "Chromatin assembly" and "Chromatin assembly and disassembly" too.
Graph control (side panel)
Layouts
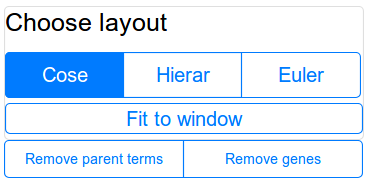
Currently three types of layouts are supported:
- Cose (Compound Spring Embedder) layout. This layout imitates node repulsion. It is convenient for small networks containing not many genes (100 or less). This layout is depicted in example above.
- Hierarchical layout. This layout displays nodes in their hierarchy. Less specific GO terms are placed at the top of the network while more specific GO terms are placed at the bottom. Genes (if visualized) are positioned at the very bottom level of the graph. This layout is especially useful for big networks containing a lot of GO terms.
- Euler layout. Another force-directed (physics simulation) layout similar to Cose layout which runs faster so is more suitable for large networks.
Simplifying the graph
When the network becomes too heavy due to plenty of genes or GO terms, features "Remove parent terms" and "Remove genes" can be handy. The first one toggles the visibility of GO terms not connected to any genes, e.g. "Chromatin assembly" in example network. The second one obviously toggles visibility of the genes allowing for exploration of GO terms only.
Accessing node data
Clicking on the nodes or edges shows table with information about the object clicked.
Genes
In case of gene being clicked the data table looks like this
| Gene name | NOG |
| UniprotID | Q13253 |
| EnsemblID | ENSG00000183691 |
| DICE-DB | NOG |
| Genecards | NOG |
| Expression (TPM) in [user_supplied] | -0.73 |
In the table you can access corresponding references to external pages for the entry as well as expression data
GO terms
By clicking on the GO term its description, p-value and corresponding genes can be viewed like this
| GO term ID | GO:0031497 |
| Definition | chromatin assembly |
| p-value | 8.9e-6 |
| p-value (FDR adjusted) | 1.6e-2 |
| Genes annotated with | HIST1H1E HIST1H1B HIST1H1D HIST1H1C HIST1H2BC HIST2H2BC |
Note that gene badges are clickable and show corresponding gene information. This is useful for exploration of large networks with a lot of GO terms when genes are removed from the graph.
Edges
Clicking an edge connecting gene and GO term shows the most specific descendants of the term annotating the gene.